 State of the Marketplace Executive Summary
Although tragic airline losses have dominated aviation insurance results over the past year, these catastrophic losses have not yet had a negative impact on pricing or capacity in the aviation insurance market. The reinsurance market continues to soften, competition is driving down rates on desirable classes of assets and 200%+ capacity is currently available. We expect a push back on rates in Q2 2015, but no real traction as over capacity and competition for market share continues to drive the rating.
The cost of healthcare has continued to increase at a rate of approximately 4 percent to 5 percent year over year on a national basis. The majority of the focus for employers is on health coverage, especially for those with over 1,000 employees as they typically self-insure. The majority of the impact from ACA has been to increase premiums for the individual and small employer market. To offset the rising costs, employers have moved aggressively to high-deductible plans and have investigated private exchanges. Future increases in health care spending will continue and the future viability of private exchanges is uncertain at this point.
In the fourth quarter of 2014, we observed flat to moderate rate increases for Workers Compensation, General Liability and Automobile Liability lines of coverage when renewed with an incumbent market. There was a slight uptick in Umbrella and Excess Liability market capacity with some new entrants in the Bermuda and London markets. Global capacity remains in excess of $1 billion.
The persistent softness of the market continues to challenge medical professional liability insurers despite record profits and low loss ratios. To remain competitive, markets have been forced to decrease rates and premiums. There is an abundance of capacity in the marketplace with new market entrants, as well as a willingness of current markets to expand their capacity. The record high reinsurance capital and stable to weak growth in reinsurance demand has driven, and will continue to drive, softening in the global reinsurance market for medical professional liability. The competitive market environment is expected to continue throughout 2015, driven primarily by surplus capacity, with pricing stable to slightly decreased in most venues.
An abundance of capacity and new market entrants have created competition in the Directors & Officers Liability space, driving overall D&O pricing lower over the last year or so, with the trend continuing in to 2015. The Employment Practices Liability, Fiduciary Liability, Commercial Crime and Financial Institution Bond markets continue to remain stable. We expect market and pricing trends to continue. Premium increases, increases in retentions and certain coverage limitations are expected in the Retail, Healthcare, Financial Institution and Higher Education industry segments as carriers seek to manage and limit their exposure and price for it as adequately as they can.
The marine cargo marketplace remains soft. Coverage terms are extremely broad with most, if not all, markets agreeing to broker manuscript policy forms. We fully expect the soft market trend to continue (at least until interest rates rise), which could potentially curtail some of the alternative capital flowing into insurance markets. Generally, underwriting results in the marine insurance market are less than satisfactory. Coverage conditions for Marine Hull and Marine Liability remain mostly unchanged. Our forecast for the foreseeable future is a continued soft market with rate reductions continuing on loss free accounts.
Capacity is plentiful and increasing with several new markets opening up or expanding their offerings. We are seeing a growing Capital market presence in vehicles like cat bonds, side cars and other Insurance Linked Securities, which are adding to the overall surplus available as reinsurance vehicles to the primary insurance writers. Given the low interest rate environment, insurance companies continue to produce steady returns for investors on a moderate to low risk basis.
New companies continue to enter the market; Reinsurance continues to be a buyers' market; Competition in certain sectors of the market continues to put pressure on rates. The surety industry will face some major challenges in 2015. Fortunately the industry as a whole is positioned to meet underwriting losses due to strong balance sheets and spread of risk via multi company participation and the judicious use of reinsurance. We continue to believe that there will be increased M&A activity in the surety space in 2015.
Generally, most Logistics Liability policies renewed flat or with rate decreases. Customs Bonds pricing has remained flat. Rates remained flat, but premiums have slightly increased with volume increases by U.S. based forwarders. Pricing should remain flat for both Logistics Liability policies and Customs Bonds.
 Aviation
Despite the recent number of Airline losses, aviation remains one of the safest forms of travel with over 87,000 aircraft flights daily in the U.S. alone. The overall safety record of the industry and the standards imposed by the FAA (and similar regulatory bodies outside the U.S.), as well those developed by industry groups such as the International Air Transport Association, give underwriters of aviation insurance a high degree of comfort regarding the risks of loss associated with aviation operations. While airline risks and losses garner a lot of media attention, aviation insurance encompasses a wide range of risks including aircraft operations of many types, manufacturing and even satellite and spacecraft risks. Most underwriters do not limit themselves to one narrow aspect of aviation risk and, therefore, have a spread of risks in their portfolio. Therefore, although tragic airline losses have dominated aviation insurance results over the past year, these catastrophic losses have not yet had a negative impact on pricing or capacity in the aviation insurance market to date.
Recent airline losses have impacted a wide number of aviation markets and raised concerns about reserves levels and practices. However, despite these large losses into the industry in 2014, and $300MM in reserve anticipated for the airline loss in Q1 of 2015, the soft rate trend continues into 2015 for several reasons:
The past two years were relatively quiet from a "CAT" perspective in other market classes (property, etc.).
Capacity is plentiful and continues to grow as new entrants move into the aviation space and many insurers look to write larger lines to maintain premium level in the face of falling rates.
Depending upon the continued loss trend, we expect a push back on rates in Q2 2015, but no real traction as over capacity and competition for market share continues to drive the rating. Any expectation for a hardening of the market would be precipitated by consolidation of markets and a significant reduction in the available capacity.
Benefits Consulting The majority of the focus for employers is on health coverage. Most employers with over 1,000 employees self-insure their health coverage and may or may not purchase reinsurance to provide some stop loss coverage for large individual claims. In 2014, the average cost for coverage for a family of four was $23,215 according to Milliman. This was up 5.4 percent year over year and was the lowest annual increase since 2002. Future increases in health care spending will continue but may be influenced by other factors such as:
Although the trend of increase to deliver high quality health care has slowed, the cost of healthcare has continued to increase at a rate of approximately 4 percent to 5 percent year over year on a national basis.
The ACA requires employers with more than 100 eligible employees (more than 50 in 2016) to offer affordable health insurance; otherwise, they face penalties for not offering coverage. The act has done little to control costs for large employers. The majority of the impact from ACA has been to increase premiums for the individual and small employer market.
To offset the rising costs, employers have moved aggressively to high-deductible plans and have shifted more of the cost through payroll deductions. On average, employees now contribute 42 percent of the total cost of care through payroll contributions and out of pocket costs (deductibles and coinsurance). This equates to $9,695 for a family of four and is a 2.9 percent increase year over year.
Pharmacy spend continues to increase at a dramatic rate in the high to mid-teens after annual increases in the 20 percent to 22 percent range. One of the drivers impacting this trend in recent years is the fact that the cost of many medical procedures can now be shifted to pharmacy spend. Many new drugs continue to enter the market. There are 1,258 new specialty drugs currently in the developmental pipeline targeting over 300 diseases. The average cost of a specialty drug is now $1,500 per month. According to a study by Drug Channels Institute, half of generic drugs studied had a significant rise in acquisition cost with a median increase of 11.8 percent during the period of July 2013 to July 2014. While some of this inflation in generic drugs is due to shortage in raw materials, the inflation is also attributed to manufacturers entering and exiting the market.
These trend of increase factors are forcing plan sponsors to invest more time and resources in much greater strategic collaboration requiring true consultancy. We do not foresee this level of increase in expense dropping dramatically over these next few years.
As we look to the second half of 2015 and out into 2016, it will be a time of continued significant change and turmoil in the health insurance marketplace. Insurance carriers are being pushed to deliver more creative options to allow Employer/Plan Sponsors to be in a position to have the ability to meet their mandated Benefit Plan Design and Premium Safe Harbor requirements as required by the Affordable Care Act. Fierce marketplace pressure is creating a dramatic drain on insurance company internal resources. This convergence of increased service and pricing pressure should result in continued mergers and acquisitions among health insurance carriers. In particular, we anticipate the acquisition of smaller regional players by major health insurance carriers such as United HealthCare and Aetna HealthCare. We also anticipate that major health insurance companies will look to acquire, or aggressively partner with, well managed, effective "Population Management" or "Wellness" vendors who can effectively deliver a strategic vertical integration to better deliver the type of effective disease management that allows the Employer/Plan Sponsor to deliver the most cost effective health plan possible.
Engaged employers are now finding themselves forced into a coaching, communication and advocacy role for their employees and their eligible dependents as the financial stakes have increased in such dramatic fashion. The committed Employer/Health Plan Sponsor who can improve, maintain control and aggressively manage this process will enjoy a significant financial advantage over their competitors. We anticipate that the next two to three years will see an unprecedented amount of change in our industry. Non-traditional vendors such as Walmart, Costco and Walgreens may very well come to have a prominent position in the delivery of primary care medicine. Traditional providers of health care service will look for alternate ways to deliver more strategic and sustainable cost effective solutions. The landscape of health care may look much different by the year 2020.
Casualty| Coverages | Rate change Q4, 2014 | Rate change Q1, 2015 |
| Workers Compensation | +.7% | Flat to slight increase |
| General Liability | -.4% | Flat |
| Automobile Liability | +.4% | Flat |
Workers Compensation, General Liability and Automobile Liability
In the fourth quarter of 2014, we observed flat to minimal rate increases for Workers Compensation, General Liability and Automobile Liability lines of coverage when renewed with an incumbent market. If a primary casualty program was put out to competitive bid, slight rate decreases were obtained. For loss sensitive programs, underwriters continued their efforts to push for optimal retentions/deductibles.
On January 12, 2015 President Barack Obama signed H.R. 26, the Terrorism Risk Insurance Program Reauthorization Act of 2015 (TRIPRA 2015), into law. Many markets were not fully prepared for the potential expiration of TRIPRA and are just now cleaning up their policy language. With TRIPRA 2015 now enacted into law we recommend a close review of Workers Compensation policies to make sure any conditional terrorism exclusion is deleted and declared null and void.
Umbrella and Excess Liability
There was a slight uptick in market capacity with some new entrants in the Bermuda and London markets. As with the fourth quarter of 2014, there were moderate rate increases for the more volatile classes of business. For those accounts in the softer categories, competition resulted in rate decreases. This trend continued in the first quarter of 2015. Underwriters continue to look to ventilate their capacity throughout a tower.
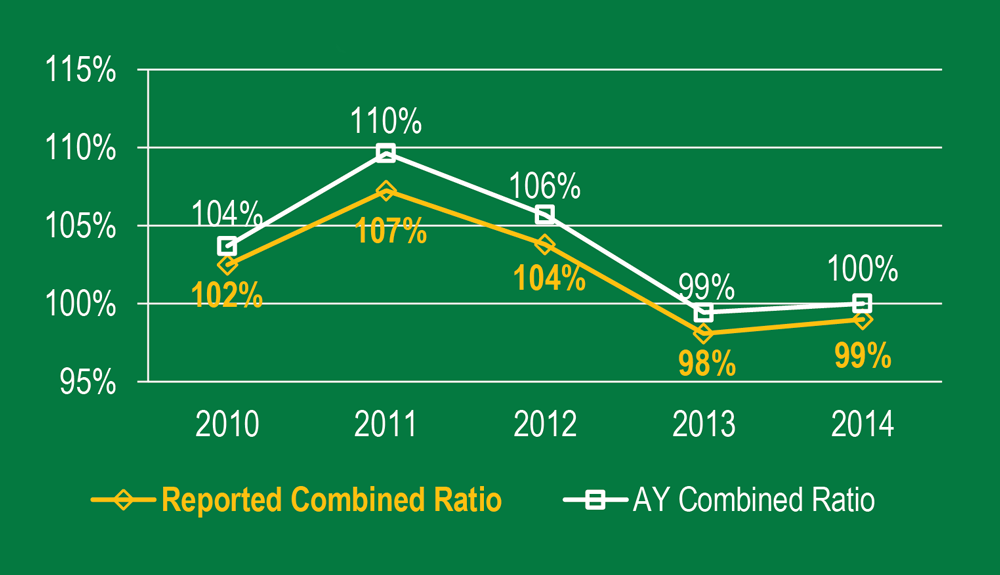
HealthcareHeavy competition and abundant capital has driven a softening in the market with rates decreasing for the past several years, despite an increase in the severity of incurred losses since 2010. Competition has compelled companies to compete in new markets as they deploy capital and diversify exposure.
A shifting regulatory and judicial environment is expected to impact loss frequency and severity for insurers. The Affordable Care Act will drive an increase in the demand for medical services as millions of U.S. citizens are purchasing health insurance, many of whom have not previously received preventative care. Medical resources will be strained with the influx of new patients into the system, which has the potential to lead to missed diagnoses, medical errors, and lawsuits.
As the risk of claim frequency rises, medical providers and healthcare systems are faced with a potential rise in multi-million dollar lawsuits.
The movement of physicians from private practice into hospitals and other large institutions will continue in 2015. Traditional physician insurance companies continue to lose market share to captive insurance companies and Risk Retention Groups.
Commercial insurers face the threat of lower investment returns, negatively impacting their profit margins. Companies are investing the funds from maturing bonds into new bonds at lower rates, thus reducing investment income. These lower investment yields put pressure on insurers to write business at rates that ensure underwriting profits while battling fierce competition from new capacity.
While the expectation is that these profit margins will continue to decline, it is difficult to predict the severity of this drop. A moderate reduction in profits could reduce competition, but more than likely will not compel major changes to the medical professional liability industry; however, if conditions deteriorate to the point that it causes peak losses, some companies may be forced to withdraw from the market or from certain segments of the market.
Managed Care E&O
Managed Care Organization E&O is a growing area of exposure. The exposure of large health insurers is a recognized field, but new exposures are developing within healthcare systems and large physician groups as they grow in complexity. These structures are forming Accountable Care Organizations and their own insurance companies to write health benefits, and participating in contracts with insurance companies in which providers assume expanded responsibility for disease management, enrollee tracking and management, and advisory services to outside practices.
Underwriters are concerned about current or future claims alleging:
The persistent softness of the market continues to present challenges to medical professional liability insurers despite record profits and low loss ratios. In order to remain competitive, markets have been forced to decrease rates and premiums. This accommodation, driven by external forces, may prove to be short sighted if loss development escalates in future years. There is an abundance of capacity in the marketplace with new market entrants, as well as the willingness of current markets to expand their capacity. This capacity continues to exert pressure on medical professional liability insurers to keep insurance premiums low in order to retain clients.
Another challenge facing the marketplace is the regulatory and judicial environment with the evolving nature of tort reform and the implementation of the Affordable Care Act. Combined with the influx of patients into the healthcare system, these changes may drive up loss frequency and severity for insurers with the influx of patients into the healthcare system.
Medical professional liability insurers continue to see the movement of physicians from private practice to hospitals and other large institutions, most of whom self-insure their liability exposures, often for smaller overall premium than the individual physicians paid to their commercial physician carrier.
The record high reinsurance capital and stable to weak growth in reinsurance demand has driven, and will continue to drive, softening in the global reinsurance market for medical professional liability. The competitive market environment is expected to continue throughout 2015, driven primarily by surplus capacity, with pricing stable to slightly decreased in most venues.
Management RiskCertain D&O trends and litigation outcomes are driving primary carriers to seek increases, despite the premium competition among excess layer carriers.
Dodd-Frank recoveries and whistleblower litigation is on the rise. In 2014, SEC whistleblower awards were greater than the combined total of all other program years. The SEC Office of the Whistleblower received 3,620 whistleblower reports under the Dodd-Frank Act during 2014—a record number and substantial increase from the 3,328 reports received in 2013.
The False Claims Act had the highest ever one-year total of recovery in 2014, at $5.69B. It is worth noting that $3.1B of that came from banks and financial institutions (ten times more than in 2013):
D&O coverage remains broad and competitive throughout the marketplace. Coverage areas that continue to warrant attention include: conduct exclusions, representations and severability language, claim definitions, and definition of loss.
In addition, steady increases in losses in the network security and privacy area require that we keep a watchful eye towards how carriers will manage their exposure to these claims. Carriers have made a practice of inquiring with their insureds regarding their policies and procedures around network security and time will tell as to how much of an effect these claims will have on D&O losses.
The Employment Practices Liability (EPL) market remains stable heading in to the second quarter of 2015. We expect renewals to provide flat to modest premium increases overall due to adjustments by EPL carriers in retentions and premiums over the last several years. Carriers will continue to look at California exposures as a specific area of focus, perhaps still seeking to limit their exposure with higher retentions, limited capacity and higher premiums for those risks with a higher concentration of employees.
The Fiduciary Liability market continues to be stable as it has been over the last several years. We have not seen any new claim trends in this space or fluctuation in rates from the marketplace. Premium trends at renewal have been mostly flat, barring any changes in exposure. Carriers continue to address those exposures with tag-along risk (plans that invest in company stock), employee stock ownership plans and funding issues.
Despite these favorable market conditions, 2014 ERISA class action settlements exceeded $1.3B., which is nearly ten times greater than the 2013 aggregate. Fiduciary losses are low frequency, high-severity losses with "mega" settlements, including Daimler Trucks North America ($480MM) and Healthcare Strategies, Inc. ($415MM), contributing to the 2014 growth in settlement amounts.
We expect pricing trends to continue in to 2015. Fiduciary Liability insurance capacity remains plentiful with an estimate of more than $1B in capacity available in the marketplace. New entrants are expected to create continued competition in this space, keeping pricing primarily flat. This includes Berkshire Hathaway who entered the marketplace in 2014 and introduced their new primary policy form in the fourth quarter.
The Commercial Crime and Financial Institution Bond market remained stable in the first quarter of 2015. Commercial Crime premiums were flat with some decreases, while the Financial Institution marketplace experienced flat to slight increases in premiums overall.
Losses in the Crime space remained static with no significant new trends forming. Carriers continued to include exclusionary/clarifying endorsements addressing the following exposures:
Probably one of the most rapidly changing areas in the insurance landscape right now is the Network Security and Privacy marketplace. Increased attention to this coverage is continually driven by a proliferation of high profile security breaches across all industries and growing attention to these risks by our government, regulators and corporations.
The Target breach in late 2013 and the breaches that followed in 2014 and early 2015 (including Neiman Marcus, Home Depot, eBay, JP Morgan Chase, Michaels Stores, Staples, and Anthem Blue Cross/Blue Shield) have created an acute awareness in companies and their senior management teams that it is imperative and urgent to evaluate their network security exposure and provide financial protection to their organizations. It is no longer a question of if, but when, a breach will occur.
As of March 30, 2015, there have been 208 data breaches, with the remainder of 2015 promising to bring even more incidents than were seen last year. Several trends promise to make this the greatest year for security breaches, including the following:
There are over 30 carriers providing Network Security & Privacy coverage in the marketplace, which is creating plenty of capacity. Underwriters are evaluating risks much more carefully, particularly in the Retail, Healthcare, Financial Institution and Higher Education arenas. Premium increases, increases in retentions and certain coverage limitations are expected in these industry segments as carriers seek to manage and limit their exposure and price for it as adequately as they can. Small and middle market risks are the most desirable for underwriters and, due to the amount of capacity in this marketplace, the market remains competitive for those types of risk.
Carriers have consistently offered broad and new coverage offerings and we expect that will continue into 2015, extending to almost all aspects of potential loss/exposure including: Network Security and Privacy Liability, Internet Media Liability, Business Interruption Loss, Data Breach Expenses, Cyber Extortion, Digital Asset Loss, PCI Losses, Regulatory Coverage and Event Management and Reputational Damage coverages.
The larger and more successful primary carriers continue to enhance their product through their relationships with third party service providers that allow insureds to take advantage of preventative services including contract and indemnification review, breach preparedness, IT security assessment, training and compliance solutions, etc. These relationships are not only helpful to insureds on a pre-loss basis, but make available a ready team of experts to step in immediately once a loss occurs.
MarineUnderwriting results are generally favorable for those marine cargo accounts that do not include storage risks. Rate reductions are the norm for accounts with loss ratios under 50 percent over a three to five year period. Even accounts with unfavorable loss experience can leverage market competitiveness to maintain flat rate renewals with incumbent markets at renewal.
Results and rating methodology for stock throughput accounts vary by underwriter. More competitive underwriting offices tend to "loss rate" stock throughput accounts over a given time period (five to seven years). This may lead to diminishing returns for underwriters over time, as loss rating tends to account for smaller, higher-frequency events, and does not build in a "CAT-load" premium for catastrophic perils. As such, pricing for storage risks can be more competitive in the marine cargo market than in the traditional property market.
The marine cargo marketplace remains soft due to a variety of factors. Most notable is the influx of capital into insurance markets, resulting in new players seeking to gain market share. Berkshire Hathaway Specialty Insurance is the most notable recent addition to the marketplace, as they bring strong brand name recognition and excellent insuring paper (rated A++ by A.M. Best). Additionally, Bermuda and London insurers Ascot, Aspen, Catlin, and Watkins have opened underwriting offices in the U.S. in the past few years. Brokers can build upwards of $100MM / $500MM in capacity for a single insured's transit and storage exposures, respectively. Most markets can provide at least $20MM in transit capacity and $10MM in CAT storage capacity. To accommodate higher limits, quota share and layered structures with multiple insurers is commonplace.
Coverage terms are extremely broad with most, if not all, markets agreeing to broker manuscript policy forms. Some markets have recently become more reluctant to include voyage frustration coverage, likely due in part to the press surrounding potential strikes at the port of Long Beach in California.
Profit sharing is also available for most accounts when they are marketed, generally with a maximum of 25-30 percent of annual premium eligible to be returned following a loss free year.
With an abundance of capacity across the entire Property & Casualty marketplace we fully expect the soft market trend to continue (at least until interest rates rise), which could potentially curtail some of the alternative capital flowing into insurance markets. Additionally, an active CAT year could also lead to rate increases for accounts with storage risk.
Generally, underwriting results in the marine insurance market are less than satisfactory to underwriters' profitability. The marine market continues to have excess capacity, which enhances competition and drives a continuing need for growing premium income. It is also worth mentioning that due to the depressed interest rate environment, the drive is for "loss free" premium income. The result is that accounts with clean loss records and demonstrated safety programs are highly sought after and enjoy favorable renewals. The simple forces of supply (capacity) and demand keep it a buyer's market.
Many clients are coming to market as improved risks with newer fleets, improved loss records and safer operations. In many cases, Integro has been successful in leveraging these factors into favorable renewals for our clients. And for those clients who have recently presented the market with large or significant claims, premiums may increase upon renewal but can be mitigated (within reason) by the market forces and over-supply of capacity.
Generally, markets are reluctant to lose a profitable piece of business. Because of this, clients with long-term insurer relationships will be successful in obtaining rate reductions. Further, the same markets looking to grow premium income (partially to offset the reductions on their renewal book), can aggressively seek to win a new piece of business.
Behind the scenes in the marine reinsurance market, there are two main forces at play keeping reinsurance costs down. First, there is more reinsurance capacity (capital) than ever and second, direct marine insurance companies are retaining more risk (buying less reinsurance). This reality of increased supply and decreased demand keeps considerable pressure on pricing.
Notable market changes include Endurance's entrance into the market with a marine team approximately 18 months ago, and the Catlin/ XL merger announced earlier this year. This merger will likely reconcile itself this summer. Safe Harbor Pollution is quickly approaching its two-year anniversary and appears to be here to stay. However, we would speculate that none of these changes are significant enough to move the market in any meaningful way.
Coverage conditions for Marine Hull and Marine Liability remain mostly unchanged except for Loss of Hire coverage, which is largely unavailable in the U.S. market. However, we have seen two markets quote Loss of Hire coverage in competitive situations during the first quarter.
Lastly, effective January 1, 2015 in the United States the long predicted phase-out date has arrived for single hull tank vessels. The National Pollution Fund has notified vessel pollution insurers that they must cancel outstanding Certificates of Financial Responsibility (COFR) for single hull tank vessels. Further, the Coast Guard has rescinded the Certificate of Inspection for any single hull tank vessel regardless of size. Therefore, it is now illegal to load any oil or petrochemical into a single hull tank vessel. Because of this phase-out, we saw a rush to move to newer double hull tank vessels over the last 18 months. As noted earlier, newer fleets provide a more attractive risk to the market.
Our forecast for the foreseeable future is a continued soft market with rate reductions continuing on loss free accounts. Accounts with losses will see nominal rate increases, but such rate increases will be tempered by the oversupply of capacity. Coverage conditions will remain unchanged and certainly no less broad than they are now.
PropertyClients with renewals during the first quarter of 2015 saw robust competition for their business as carriers sought to write new business to offset declining rates on existing accounts. Many multi-participant programs were over-subscribed, while single-carrier programs were likewise seeing significant competition.
For larger, catastrophe-heavy (CAT) insureds, rate decreases were generally between 10 percent and 20 percent depending on the unique characteristics of each risk (e.g. loss history, current rate, CAT modeling). Non-CAT and smaller risks experienced rate decreases between 5 percent and 10 percent also depending on the unique characteristics of each risk.
Many insurers are using increased values (capital and Business Interruption) that are the result of an improving economy to justify rate decreases. The higher values help to blunt the resultant premium decrease from lower rates.
The competitive pricing and capacity is cutting across most industries and classes of business. The notable exception is frame habitation due to several high-profile losses over the last two to three years.
Prices in the Difference-in-Conditions (Earthquake/Flood/Windstorm) market are falling with some exceptions, such as Mexico windstorm and high hazard flood.
Capacity is plentiful and increasing with several insurers opening up or expanding their offerings. For example, Endurance and Canopius are offering new property capacity in the U.S., and Berkshire is expanding its capacity, now writing energy and technology risks. We are also seeing increased capacity from carriers such as Crum & Forster and Ironshore. A growing capital market presence in vehicles like CAT bonds, side cars and other insurance linked securities is becoming more and more a factor. While they might not offer direct capacity on a specific risk, the capital markets are adding to the overall surplus available as reinsurance vehicles to the primary insurance writers.
Given the low number of CAT losses in recent years and the overall low interest rate environment, insurance companies continue to produce steady returns for investors on a moderate to low risk basis. Many believe it would take several large scale CAT events and a simultaneous financial event to really turn the insurance market (e.g., a spike in interest rates and a major Hurricane event).
SuretyLast year was another successful one for the surety industry. As a whole, the industry experienced year over year growth of 4.66 percent to $5.5 billion in written premium. The direct loss ratio moderated to 14.99 percent from 16.26 percent in 2013.
The industry saw a continuation of several trends in 2014:
The surety industry will face some major challenges in 2015. Rate and underwriting pressure are probably here to stay for a long time barring a major catastrophic economic event within the industry. The energy space, which is a heavy user of surety credit, is particularly challenged as the prices of coal, oil, and natural gas have plunged. Fortunately, the industry as a whole is positioned to meet underwriting losses due to strong balance sheets and spread of risk via multi company participation and the judicious use of reinsurance. We continue to believe that there will be increased M&A activity in the surety space in 2015.
Trade & LogisticsGenerally, most Logistics Liability policies renewed flat or with rate decreases. Customs Bonds pricing remained flat. While rates remained relatively flat, premiums increased on par with the overall revenue growth of our transportation clients.